Visual Reports (Reports)
Last updated July 6, 2026 · Admins, office staff, and owners
Visual Reports are four ready-made dashboards – Financial, Operations, Sales Funnel, and Customers & Programs. Each one is a set of KPI tiles and charts that give you a visual pulse on part of your business over a date range you choose. Unlike the custom report builder, there’s nothing to set up: you pick a dashboard, pick a date range, and read the charts. For how this compares to the other reporting tools, see Reporting Overview.
Before you start
- An operator account with access to the Tools -> Visual Reports menu.
- Some history in the system (invoices, visits, leads, customers) for the selected date range, or the charts will show “No data for this period.”
How to open Visual Reports
- In the left sidebar, open the Tools group.
- Click Visual Reports.
That takes you to the Visual Reports page. (If you ever type the address by hand, use the page the menu opens – the plain /VisualReports address on its own does not resolve; always reach it from the Tools -> Visual Reports menu link.)
The page at a glance
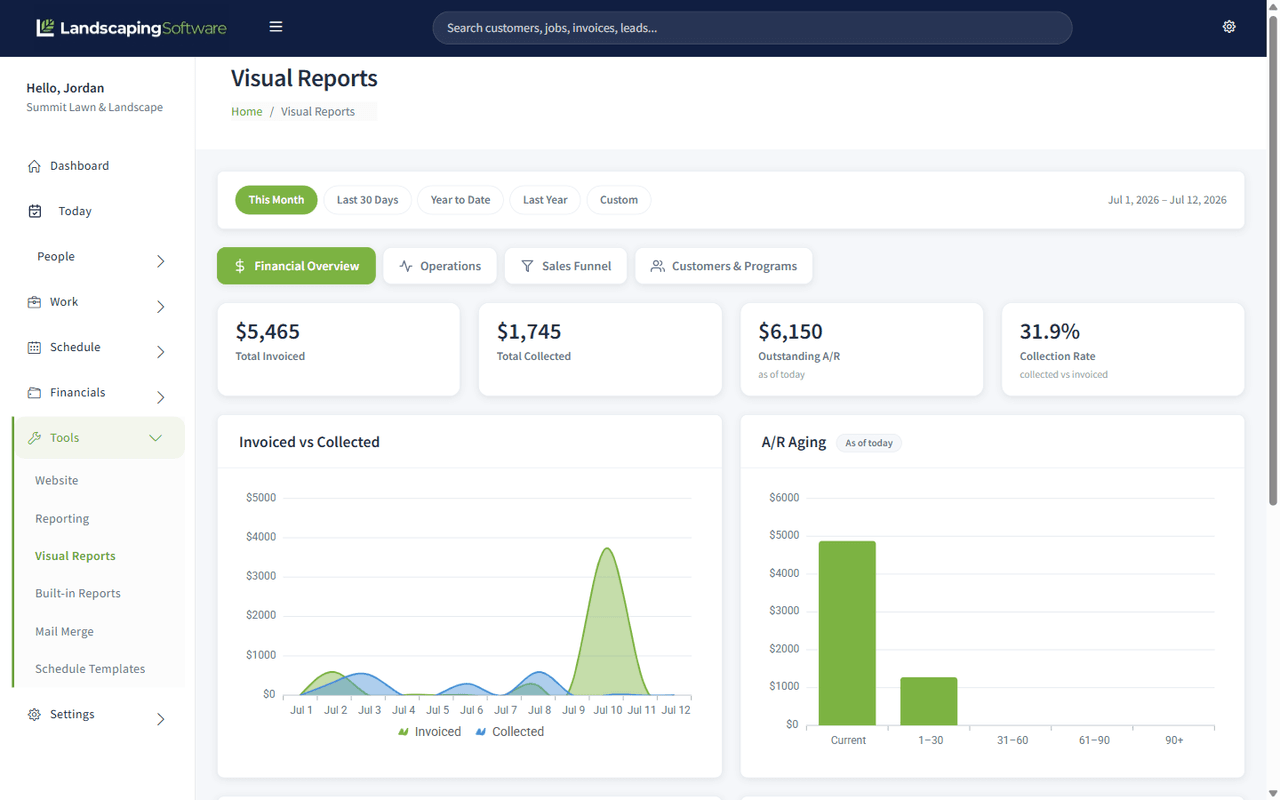
- A row of date-range buttons at the top: This Month, Last 30 Days, Year to Date, Last Year, and Custom.
- A row of dashboard tabs – Financial Overview, Operations, Sales Funnel, and Customers & Programs.
- Four KPI tiles for the selected dashboard.
- A grid of charts for the selected dashboard.
Steps
- Go to Tools -> Visual Reports.
- Click the dashboard tab you want (Financial, Operations, Sales Funnel, or Customers & Programs). The KPI tiles and charts load for that dashboard.
- Pick a date range using the buttons at the top. This Month is selected by default. Choose Custom to open a date picker and set your own start and end dates.
- Read the KPI tiles and charts. Some charts carry an “As of today” badge – those are point-in-time snapshots (like current A/R or current job statuses) that always reflect today and ignore the date range.
- Switch tabs or change the date range at any time; the dashboard refreshes in place.
What each dashboard shows
Financial Overview
Revenue, collections, and receivables.
- KPI tiles: Total Invoiced, Total Collected, Outstanding A/R (as of today), Collection Rate (collected vs. invoiced).
- Charts: Invoiced vs Collected, A/R Aging (snapshot), Payments by Method, and Largest Outstanding Invoices (snapshot).
Operations
Visit throughput, job pipeline, and crew output.
- KPI tiles: Visits Completed, Visits Scheduled, Completion Rate, Jobs Created.
- Charts: Visits Completed over time, Jobs by Workflow Status (snapshot), Crew Productivity, and Schedule Utilization.
Sales Funnel
Lead flow, estimate outcomes, and pipeline value.
- KPI tiles: New Leads, Leads Won, Estimate Win Rate (accepted vs. declined), Pipeline Value (open estimates, as of today).
- Charts: Lead Funnel, Leads by Source, Leads Created vs Won over time, and Estimate Outcomes.
Customers & Programs
Customer growth, plan enrollment, and renewals.
- KPI tiles: New Customers, Active Customers (as of today), Active Plans (as of today), Auto-Renew (share of active plans).
- Charts: Customer Growth, Plan Enrollment (snapshot), Upcoming Renewals, and Top Customers by Revenue.
What happens next
The dashboards read live from your data, so the numbers reflect whatever is in the system when you open the page. Nothing is saved – Visual Reports are for viewing, not for building or exporting. When you need the underlying list of records (for example, which invoices make up Outstanding A/R), switch to the custom report builder.
Tips & best practices
- Use the date-range buttons for quick comparisons. Flip between This Month and Last Year to see how a period stacks up.
- Remember the “As of today” badge. Snapshot charts (A/R aging, job statuses, plan enrollment, pipeline value) always show current state – changing the date range won’t move them.
- Pair a dashboard with a custom report. The dashboard shows the trend; a saved custom report gives you the row-level detail behind it.
- Custom date ranges are capped at roughly three years – keep ranges reasonable for the fastest load.
Troubleshooting
- A chart says “No data for this period” – there are no matching records in the selected date range. Widen the range or pick a different preset.
- “Couldn’t load report data” appears across the page – a connection or server hiccup. Refresh the page and try again.
- A single chart shows “Couldn’t load this chart. Try refreshing.” – reload the page; if it persists, contact support.
- The plain
/VisualReportsaddress doesn’t open anything – reach Visual Reports through the Tools -> Visual Reports sidebar link rather than typing the address. - A custom date range is rejected – the start date must be on or before the end date, and the range can’t exceed about three years.
Related articles
- Reporting Overview – how visual dashboards compare to custom and built-in reports
- Build a Custom Report – get the row-level records behind a dashboard number
- Built-in Reports – Season Summary (with CSV export) and the other module reports